
 English
 Français
This post is also available in: French
by Franklin Templeton Emerging Markets Equity
Key Takeaways
- Developed market (DM) central banks have started to raise interest rates, led by the Bank of England.
- Emerging market (EM) fundamentals are better in the current tightening cycle compared to history.
- The current and 2015 US rate hiking cycles have similarities for EM equities, based on economic and market fundamentals. In the 12 months after the first US rate hike in December 2015, the MSCI Emerging Markets Index rose 10%.
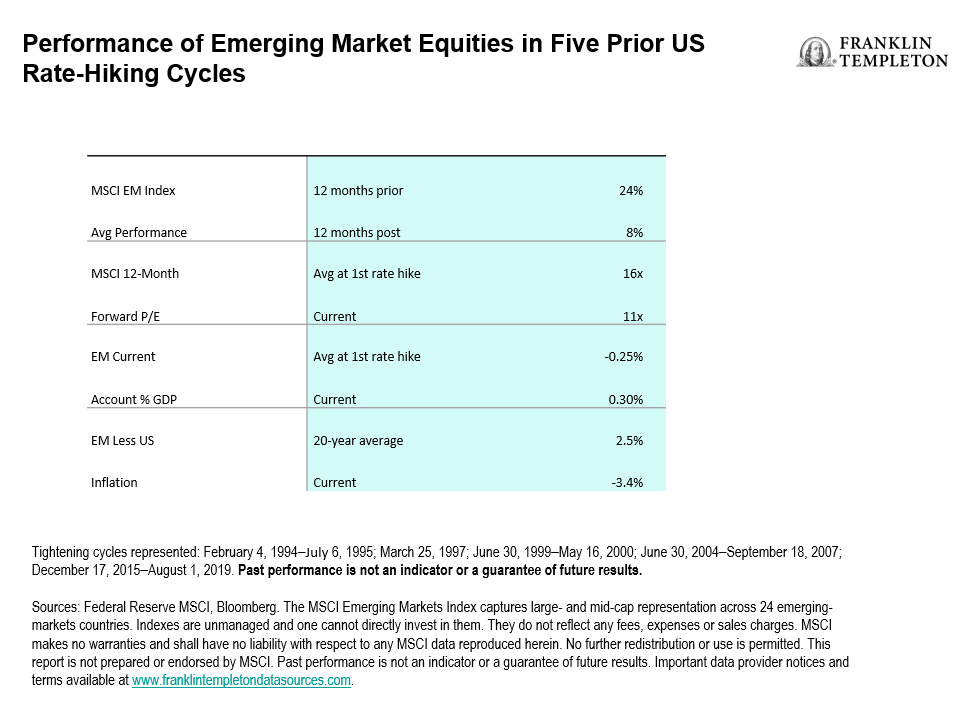
- In the five previous US rate hiking cycles, the MSCI Emerging Markets Index on average performed better in the 12 months prior to the first US rate hike than in the 12 months following; nevertheless, the gains in the latter period remained positive.
The current period of rising rates and declining markets is unnerving, but it is also creating opportunities. The Franklin Templeton Emerging Markets Equity team believes in taking a long-term view and doing bottom-up research; searching for companies that have sustainable earnings growth, trade at a discount to intrinsic worth and have competitive advantages which are persistent and repeatable over time. In the current market decline, we observe many companies with these characteristics. This is creating opportunities for our investment team to increase exposure to these companies in preparation for the eventual recovery.
EM Fundamentals
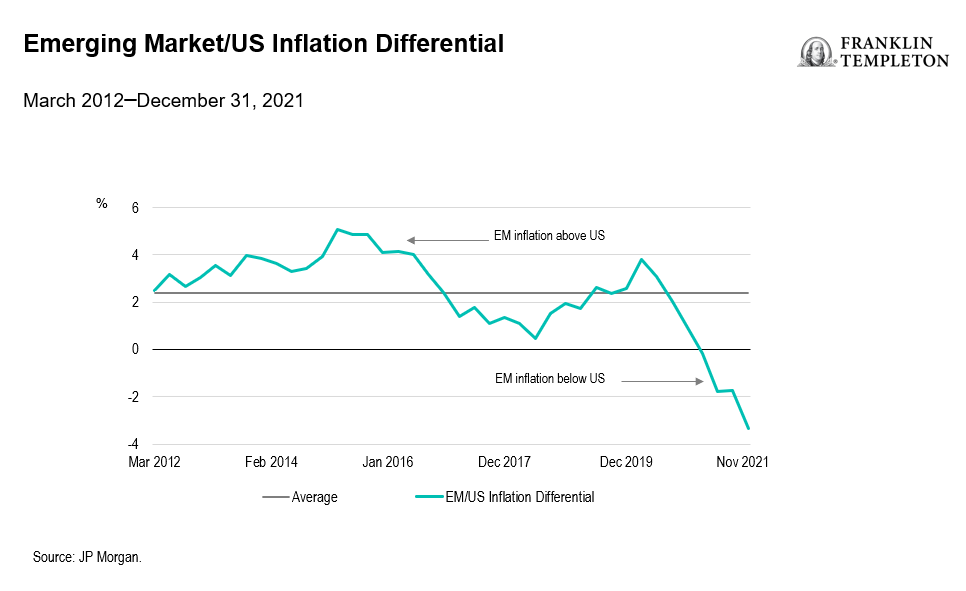
The primary differentiating factor between US and EM economic fundamentals in the current cycle is inflation, in our analysis. Over the past 20 years, EM inflation has historically been 2.4 percentage points (ppts) above that of the United States.1 Higher inflation implies higher interest rates and a higher cost of capital in EMs.
However, the current cycle is different. Based on year end 2021 data, EM inflation is 3.4 pp below that of the United States,2 driven by the unprecedented fiscal stimulus, the spike in commodity prices, and post COVID-19 supply chain issues.
Moreover, the current account position of EMs looks more comfortable in the current rate tightening cycle compared to history. In the prior five US rate tightening cycles, the average EM current account deficit was -0.25% of gross domestic product (GDP). As of end 2021, the EM current account was in surplus of 0.3% of GDP.3 Whilst interest rates in EMs are rising, lower inflation and a superior current account position imply that interest rates may peak at lower levels than in prior cycles.
Added to the better economic fundamentals are market valuations. In the prior five US rate tightening cycles, the 12-month forward price-to-earnings (PE) ratio was 16x, compared to 11x currently.4
Back to 2015
Of the prior five US rate tightening cycles, the greatest similarity to current for EM equities is the 2015 cycle. The US fed funds rate in 2015 and at the start of the current tightening cycle was near zero. The MSCI EM Index P/E ratio in 2015 and at the start of the current tightening cycle is similar: 11x.5
The performance of the MSCI EM Index in the 12 months prior to the first US rate hike in December 2015 was -14%. In the current cycle, the MSCI EM Index is down 22% over the past 12 months.6
In the 12 months following the first US rate hike in December 2015, the MSCI EM Index rose 10%, compared to an average gain of 8% in the prior five US rate tightening cycles.7
Impact of Rising US Interest Rates on EMs
We do not believe that rising US interest rates imply weaker EM equity markets. Of the five prior US rate hiking cycles, the performance of EM equities has been positive, with an average gain of 8% in the 12 months post the first US Federal Reserve rate hike. Breaking it down into individual periods highlights three cycles with gains, and two with losses.
Selected EMs are facing inflationary pressure, and policy makers are reacting to this with higher rates. Central banks in Argentina, Brazil and Poland have raised interest rates by 50-200 basis points8 so far this year. However, other central banks are in easing mode, including China, which cut its loan prime rate by 10 basis points in January 2022.9
It is clearly a mixed picture on the stage, pace, and direction of interest rates across DMs and EMs. The historical evidence shows that EM equities perform better in the 12 months prior to the first US rate hike than in the 12 months after. Nevertheless, gains in the latter period remained positive.
Taking a Long-Term View
Economic fundamentals and the evidence of history are relevant, but every cycle has different drivers. The current down cycle is driven by the after-effects of the unprecedented fiscal stimulus, the spike in commodity prices, and post COVID-19 supply chain issues impacting inflation, and the war in Ukraine impacting investor risk appetite. An aversion to holding risky assets currently prevails amongst many investors; what started with investors selling Russian equities has spread to China and other EM equity markets. In such circumstances, we believe having a long-term perspective is valuable.
Franklin Templeton Emerging Markets Equity opened its first office in Hong Kong in 1987. Our investment team has experienced the Mexican crisis in 1994, the Asian financial crisis and Russian default in 1997/98, the SARS epidemic in 2003, the global financial crisis in 2007 and the consequences of the Chinese renminbi depreciation of 2015/16. What each of these crises has taught us is the value in having a long-term perspective and the knowledge that each downturn was a buying opportunity.
Having a long-term perspective means adhering to our investment philosophy in good times and bad. Companies with sustainable earnings growth and competitive advantages that are persistent and repeatable tend to have premium valuations. The lessons we have learned from prior downturns is when companies with these characteristics drop in value and trade at a discount to their intrinsic worth as short-term investors sell, our clients benefit when we step in and increase exposure to these companies in preparation for the eventual recovery.
Franklin Templeton Emerging Markets Equity believes in taking a long-term view and pursuing a diversified investment approach. While the current period of rising interest rates and declining markets is unnerving, it is creating opportunities for investors who have seen similar crises in the past, and who understand that markets are cyclical and take a long-term view.
What Are the Risks?
All investments involve risks, including the possible loss of principal. The value of investments can go down as well as up, and investors may not get back the full amount invested. Investments in foreign securities involve special risks including currency fluctuations, economic instability and political developments. Investments in emerging markets, of which frontier markets are a subset, involve heightened risks related to the same factors, in addition to those associated with these markets’ smaller size, lesser liquidity and lack of established legal, political, business and social frameworks to support securities markets. Because these frameworks are typically even less developed in frontier markets, as well as various factors including the increased potential for extreme price volatility, illiquidity, trade barriers and exchange controls, the risks associated with emerging markets are magnified in frontier markets. To the extent a strategy focuses on particular countries, regions, industries, sectors or types of investment from time to time, it may be subject to greater risks of adverse developments in such areas of focus than a strategy that invests in a wider variety of countries, regions, industries, sectors or investments. China may be subject to considerable degrees of economic, political and social instability. Investments in securities of Chinese issuers involve risks that are specific to China, including certain legal, regulatory, political and economic risks.
Important Legal Information
This material is intended to be of general interest only and should not be construed as individual investment advice or a recommendation or solicitation to buy, sell or hold any security or to adopt any investment strategy. It does not constitute legal or tax advice. This material may not be reproduced, distributed or published without prior written permission from Franklin Templeton.
The views expressed are those of the investment manager and the comments, opinions and analyses are rendered as at publication date and may change without notice. The underlying assumptions and these views are subject to change based on market and other conditions and may differ from other portfolio managers or of the firm as a whole. The information provided in this material is not intended as a complete analysis of every material fact regarding any country, region or market. There is no assurance that any prediction, projection or forecast on the economy, stock market, bond market or the economic trends of the markets will be realised. The value of investments and the income from them can go down as well as up and you may not get back the full amount that you invested. Past performance is not necessarily indicative nor a guarantee of future performance. All investments involve risks, including possible loss of principal.
Any research and analysis contained in this material has been procured by Franklin Templeton for its own purposes and may be acted upon in that connection and, as such, is provided to you incidentally. Data from third party sources may have been used in the preparation of this material and Franklin Templeton (“FT”) has not independently verified, validated or audited such data. Although information has been obtained from sources that Franklin Templeton believes to be reliable, no guarantee can be given as to its accuracy and such information may be incomplete or condensed and may be subject to change at any time without notice. The mention of any individual securities should neither constitute nor be construed as a recommendation to purchase, hold or sell any securities, and the information provided regarding such individual securities (if any) is not a sufficient basis upon which to make an investment decision. FT accepts no liability whatsoever for any loss arising from use of this information and reliance upon the comments, opinions and analyses in the material is at the sole discretion of the user.
Products, services and information may not be available in all jurisdictions and are offered outside the U.S. by other FT affiliates and/or their distributors as local laws and regulation permits. Please consult your own financial professional or Franklin Templeton institutional contact for further information on availability of products and services in your jurisdiction.
Issued in the U.S. by Franklin Distributors, LLC, One Franklin Parkway, San Mateo, California 94403-1906, (800) DIAL BEN/342-5236, franklintempleton.com – Franklin Distributors, LLC, member FINRA/SIPC, is the principal distributor of Franklin Templeton U.S. registered products, which are not FDIC insured; may lose value; and are not bank guaranteed and are available only in jurisdictions where an offer or solicitation of such products is permitted under applicable laws and regulation.
__________________________
1. Source: Bloomberg, as of December 31, 2021. Past performance is not an indicator or a guarantee of future results. See www.franklintempletondatasources.com for additional data provider information.
2. Source: Bloomberg, as of December 31, 2021.
3. Ibid.
4. Source: Bloomberg, as of March 11, 2022.
5. Ibid.
6. Source: Bloomberg, as of March 11, 2022. The MSCI Emerging Markets Index captures large- and mid-cap representation across 24 emerging markets countries. Indexes are unmanaged and one cannot directly invest in them. They do not reflect any fees, expenses or sales charges. MSCI makes no warranties and shall have no liability with respect to any MSCI data reproduced herein. No further redistribution or use is permitted. This report is not prepared or endorsed by MSCI. Past performance is not an indicator or a guarantee of future results. Important data provider notices and terms available at www.franklintempletondatasources.com.
7. Source: MSCI, Bloomberg, as of March 11, 2022.
8. One basis point is equal to 0.01%.
9. Source: Central Bank News, as of March 11, 2022.