
Around 945 million registered voters in India will have the opportunity to elect their representatives in the Lok Sabha.1 The Bharatiya Janata Party (BJP) government has been in power since 2014. The latest polls suggest that Prime Minister (PM) Narendra Modi’s popularity will sweep him back into power at the next elections, although his party may have a diminished majority in Parliament. The opposition has formed a 26-party coalition under the acronym INDIA, but it lacks a unifying leader to rival Modi.
In its tenure, the BJP-led government has delivered tangible improvements. It has increased the number of social welfare programs and used the country’s impressive public digital infrastructure to deliver direct transfers of benefits, with less discretion in the selection of beneficiaries. There are more than 300 programs, ranging from a US$10 cooking gas cylinder to a US$2,000 house. They have reached nearly 950 million people and accounted for US$270 billion in government spending since 2017.2 Access to toilet facilities has greatly improved, and rural electrification and housebuilding have made a difference to peoples’ lives.
Investors appreciated the reduction of the corporate tax rate, the privatization of national carrier Air India, and the raised ceiling for foreign investment in insurance and defense. They also interpreted the recent interim budget as not leaving room for pre-election spending, as the government announced a slightly reduced deficit target for fiscal year 2025. What are their expectations for a third term? To deal with unfinished business.
Most investors expect a third term of a BJP-led government to continue pushing the “Make in India” agenda, which would attract foreign direct investment (FDI). They hope for enactment of the new labor law and infrastructure improvements because these are key requirements to attract FDI (the 2024 interim budget shows an increase in infrastructure funding to US$130 billion). Filling the vacant judgeships in the high courts and the subordinate courts would also be viewed as positive. Electrical power pricing is still in the hands of the state tariff-setting bodies that have been unable to balance political interest and consumer needs to deliver reasonably priced power. The introduction in 2017 of the Goods & Services Tax (GST) was revolutionary at the time, but it still doesn’t cover electricity, oil and gas, real estate, and alcohol. By and large, investors would like to see the current five GST rates reduced to one. Investors would like to see the public sector banks privatized, and the government should stop driving lending to priority sectors.
In our opinion, there is a lot of goodwill toward India, but international investors have high expectations; post-election policy execution is key to building investor confidence and therefore FDI.
But there is another reason to treat this term as an unrepeatable opportunity, because the framework for political representation in India could be radically different in five years’ time. Why? Because uneven population growth could radically change Indian election dynamics and the resulting policy direction in the future.
Overall, India has a relatively fast-growing population. But within India there is a wide variance. Broadly speaking, the southern states’ fertility rates have dropped to below replacement rates, with Kerala’s 1.5%3 close to Norway’s 1.4%.4 In the north, Bihar’s level is at 3.4%.5 In common with other democracies, India has a system of allocating political power in relation to the size of the population in its regions. But in 1976, during the “Emergency,”6 Parliament passed a constitutional amendment that froze the number of seats each state held, in accordance with the 1971 census. The freeze was to end in 2000, but it was extended to 2026. The demographic changes in these 50 years are significant. For example, representation for Bihar (population 95 million) is lower than for Kerala (28 million). It seems likely to us that there will be a significant change that will logically alter the political power balance of the states, resulting in changes in policy direction, which we think could be significant for investors in the future.
We have assessed the impact that past elections have had on India’s equity markets, and it seems to us that investing before elections can be strategically advantageous. Despite the risks, the Indian stock market, as measured by the S&P CNX Nifty Index, has consistently offered positive returns after elections, as seen in 2004 (16.1%), 2009 (38.7%) and 2014 (14.7%) over the one-year period following the election result date.7
The chart below depicts Indian stock market performance across 90 trading days before and after general election dates, beginning in 1996. On average, the stock market yielded a 3% return within roughly a month (22 trading days) following the election date. Yet, it’s noteworthy that most stock market gains typically occur prior to the election, with an average return of 10% in the four months (88 trading days) leading up to the election results date.
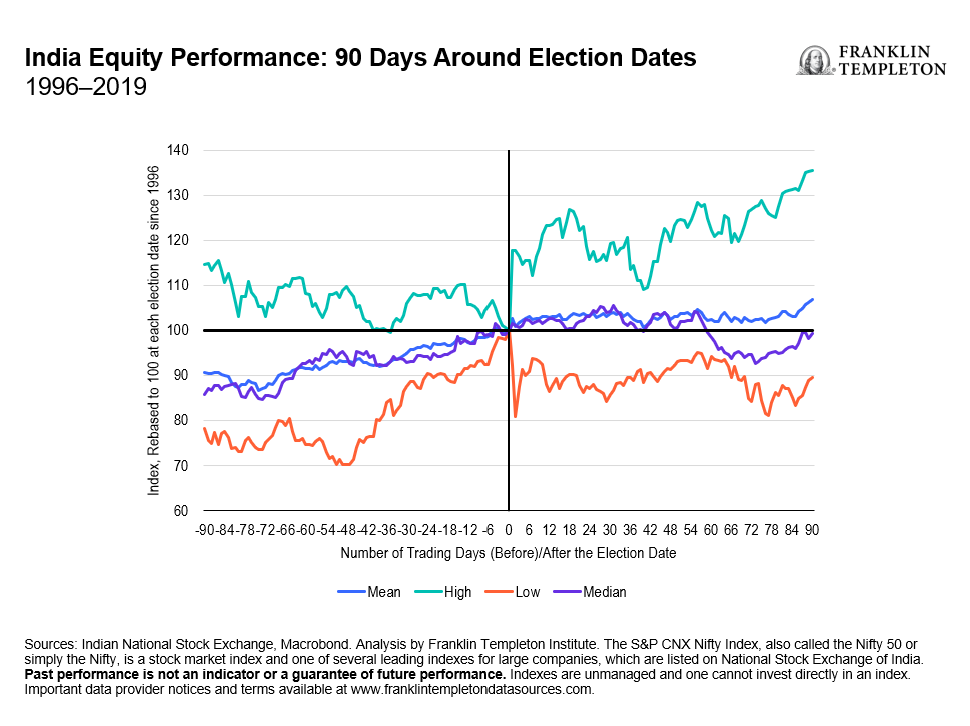
Our analysis covers seven past elections, revealing a unique instance in 2004 when the market declined both before and after the election. This election was exceptional, marking a period of significant volatility but ultimately delivering the highest returns of 108% (44% annualized) over the two-year span surrounding the election.8 High expectations for the BJP-led government’s re-election under Atal Bihari Vajpayee characterized this period, buoyed by the optimistic “India Shining” campaign. Contrary to expectations, the Congress-led United Progressive Alliance (UPA) won, initially leading to a 13.75% drop in the Nifty Index over the month following the election (22 trading days).9 However, the market recovered in the following year due to strong economic indicators.
The 2009 elections also stood out, with the stock market gaining 73.2% around 90 days before and after the election result date, driven by expectations of political continuity and economic growth.10 The UPA’s unexpected victory and formation of a stronger coalition led to a market rally, with the Nifty Index soaring 23.1% within a month after the election.11
WHAT ARE THE RISKS?
All investments involve risks, including possible loss of principal.
Equity securities are subject to price fluctuation and possible loss of principal.
International investments are subject to special risks, including currency fluctuations and social, economic and political uncertainties, which could increase volatility. These risks are magnified in emerging markets. Investments in companies in a specific country or region may experience greater volatility than those that are more broadly diversified geographically.
IMPORTANT LEGAL INFORMATION
This material is intended to be of general interest only and should not be construed as individual investment advice or a recommendation or solicitation to buy, sell or hold any security or to adopt any investment strategy. It does not constitute legal or tax advice. This material may not be reproduced, distributed or published without prior written permission from Franklin Templeton.
The views expressed are those of the investment manager and the comments, opinions and analyses are rendered as at publication date and may change without notice. The underlying assumptions and these views are subject to change based on market and other conditions and may differ from other portfolio managers or of the firm as a whole. The information provided in this material is not intended as a complete analysis of every material fact regarding any country, region or market. There is no assurance that any prediction, projection or forecast on the economy, stock market, bond market or the economic trends of the markets will be realized. The value of investments and the income from them can go down as well as up and you may not get back the full amount that you invested. Past performance is not necessarily indicative nor a guarantee of future performance. All investments involve risks, including possible loss of principal.
Any research and analysis contained in this material has been procured by Franklin Templeton for its own purposes and may be acted upon in that connection and, as such, is provided to you incidentally. Data from third party sources may have been used in the preparation of this material and Franklin Templeton (“FT”) has not independently verified, validated or audited such data. Although information has been obtained from sources that Franklin Templeton believes to be reliable, no guarantee can be given as to its accuracy and such information may be incomplete or condensed and may be subject to change at any time without notice. The mention of any individual securities should neither constitute nor be construed as a recommendation to purchase, hold or sell any securities, and the information provided regarding such individual securities (if any) is not a sufficient basis upon which to make an investment decision. FT accepts no liability whatsoever for any loss arising from use of this information and reliance upon the comments, opinions and analyses in the material is at the sole discretion of the user.
Products, services and information may not be available in all jurisdictions and are offered outside the U.S. by other FT affiliates and/or their distributors as local laws and regulation permits. Please consult your own financial professional or Franklin Templeton institutional contact for further information on availability of products and services in your jurisdiction.
Issued in the U.S.: Franklin Resources, Inc. and its subsidiaries offer investment management services through multiple investment advisers registered with the SEC. Franklin Distributors, LLC and Putnam Retail Management LP, members FINRA/SIPC, are Franklin Templeton broker/dealers, which provide registered representative services. Franklin Templeton, One Franklin Parkway, San Mateo, California 94403-1906, (800) DIAL BEN/342-5236, franklintempleton.com.
__________
1. Source: “India has over 94.50 crore voters as on Jan 1: Government.” Economic Times, February 2, 2023. The Lok Sabha is the lower house of India’s bicameral Parliament.
2. Source: “When does Welfare Win Votes in India.” Carnegie Endowment for International Peace. January 25, 2024.
3. Source: The National Family Health Survey.
4. Source: Statistics Norway.
5. Source: The National Family Health Survey.
6. The Emergency is a 21-month period of a State of Emergency controversially called by PM Indira Gandhi for “internal disturbances.”
7. Sources: Indian National Stock Exchange, Macrobond. Analysis by Franklin Templeton Institute. The S&P CNX Nifty Index, also called the Nifty 50 or simply the Nifty, is a stock market index and one of several leading indexes for large companies, which are listed on National Stock Exchange of India. Past performance is not an indicator or a guarantee of future performance. Indexes are unmanaged and one cannot invest directly in an index. Important data provider notices and terms available at www.franklintempletondatasources.com.
8. Ibid.
9. Ibid.
10. Ibid.
11. Ibid.