

Key takeaways
- One year into Lula’s presidency, Brazil’s equities have performed well against emerging market peers.
- Market concerns about ideologically driven spending sprees have not materialized.
- Economic fundamentals—including unemployment rates and consumer confidence—paint a solid picture.
- We view Brazilian equities as undervalued versus both emerging and developed market peers, especially given current strong oil prices.
- The historic relationship between oil and Brazilian equity valuations points to a significant repricing opportunity.
One year ago, shortly after the election of Luiz Inácio Lula da Silva (“Lula”) as Brazil’s next president, we argued that there was ground for optimism in Brazilian equities while markets considered the prospects of more left-wing policies with a healthy dose of skepticism. “Lula is a known quantity in Brazil,” and he inherited “an economy on solid footing with significant long-term potential” were some of the conclusions we noted then in this article: Lula returns to helm of world’s 12th largest economy: “Brazil is back”.
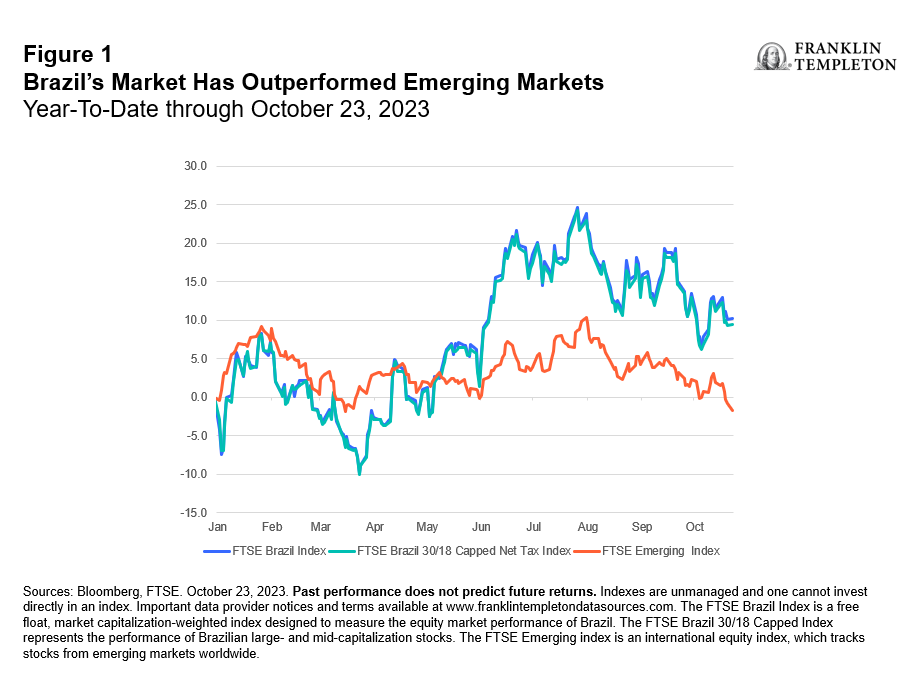
Year to date, both the FTSE Brazil 30/18 Capped Net Index and the FTSE Brazil Index outperformed broad emerging markets by about 11 percentage points at 9.4% and 10.3%, respectively, versus 1.7% as of late October (Figure 1). This has come amid expectedly significant volatility that saw Brazil equities slip 10% in mid-March and rise again by nearly a quarter at the end of July.1
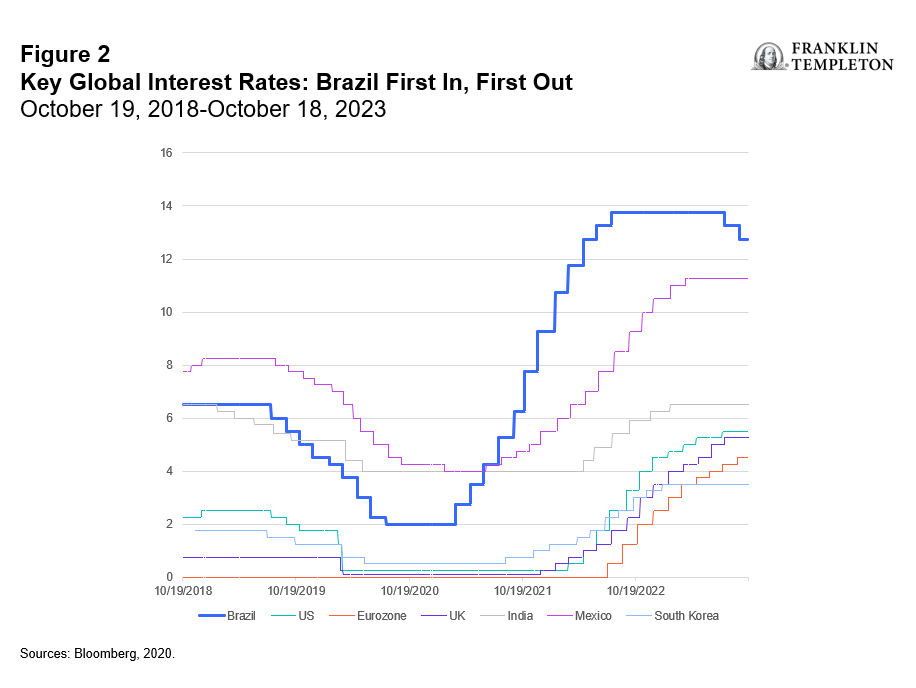
Brazil’s central bank has begun to cut rates—ahead of many emerging market (EM) and virtually all developed market (DM) peers—with the key “over Selic” (Brazilian federal funds rate) now down to 12.75% from 13.75% (Figure 2).2 Consensus forecasts for the end of this year assume another 100 basis-point cut.3 We anticipate ample room for the Banco Central do Brasil (BCB) to maneuver in 2024 if inflation maintains its downward trajectory and the effects from certain climatic events, such as El Niño, can be contained. Brazil kicked off some of the earliest and most aggressive rate hikes globally, an approach that is now beginning to pay off. While inflation, as measured by the Consumer Price Index (CPI), remains above target, expectations for 2023 and 2024 currently sit at 5.1% and 4.0%, respectively. This is a far cry from the near double digits witnessed over the course of 2022.4 Producer price growth, often seen as a precursor to the CPI, has turned negative year-on-year following its peak at around 35%.5
At the same time, the country’s unemployment rate has reached a nine-year low,6 while consumer confidence has eclipsed pre-pandemic levels and is at its highest point since 2014.7
Given all that, we view Brazilian equities as substantially undervalued, with price-to-earnings (P/E) ratios for the last 12 months (LTM P/Es) in the mid- to high-single digits, constituting a material discount to both EM and DM. We often tout the benefits of disaggregating EM exposures, for example, by means of cost-efficient, single-country exchange-traded funds (ETFs). Increasingly, diverging valuations and risk considerations are some of the drivers behind this evolving investor approach. Single-country ETFs are efficient, low-cost vehicles that investors can use to gain tactical or long-term exposure to dozens of local country holdings in a single trade.
On geopolitical risk
There is likely some domestic political risk (mainly debt-related) priced into Brazil’s valuations, but so far, Lula has stuck to the pragmatic approach we anticipated of him, and market fears over any ideologically driven spending sprees have not materialized. Furthermore, the high China exposure of broad EM indexes likely also means that these indexes already incorporate some geopolitical risk component. Yet their LTM P/Es currently stand nearly 14, while Brazil’s P/E is closer to 6.5 implying a “Brazil discount” of about 53%.8 This seems excessive, especially with the price of oil—a key driver of the Brazilian economy—riding high again in the tracks of geopolitical woes and increasing “soft-landing” hopes. Broad EM indexes are usually dominated by China and India, both of which tend to be net importers of oil. Brazil on the other hand is not only a net exporter, but also the eighth-largest producer globally, and the largest in South America. The International Energy Agency predicts that by 2040, the country will cover roughly half of the world’s offshore oil production. Its oil and gas market has accounted for most of the investment activity in the Brazilian economy for many years, contributing around 10% to the country’s gross domestic product (GDP).9 The energy sector—albeit concentrated in a couple of firms and dominated by Petrobras—makes up approximately one-fifth of the FTSE Brazil Index.10 In other words, while domestic private consumption remains the economy’s backbone with about a 60% share of GDP, oil has the potential to act as either a significant drag or turbocharger for the country’s stock market.11 We currently see oil in turbo mode, but equity valuations are moving with the brakes on.
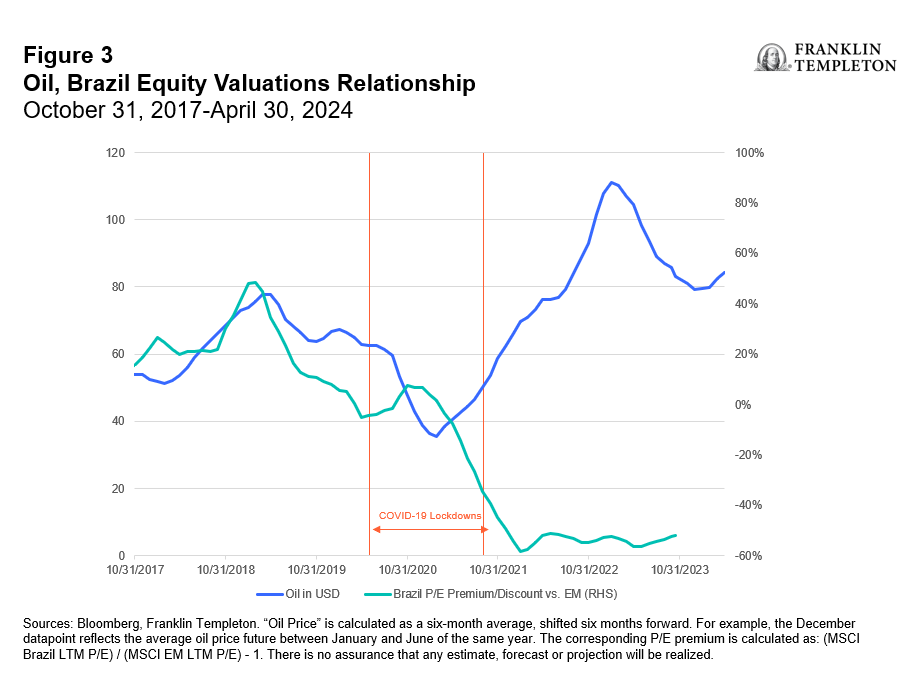
Our analysis indicates that the COVID-19 pandemic has broken the relationship between the two markets, but absent any structural reasons, we believe this decoupling could be temporary.
In the calculations that follow, we used the six-month average of Brent oil futures, shifted forward by six months. For example, the December datapoint for oil represents the average price from January to June of the same year. This corresponds with the logic that by December, some of the oil price effects from the first half of the year would be reflected in the last 12-months earnings, which form the basis for the premium/discount calculations. Figure 3 indicates the correlation between both datasets in the period leading up to the pandemic, and the curious breakdown of the relationship sometime during 2021. That coincides with the first reports of a Lula run. And recall that he had been rumored to have plans to nationalize Petrobras, which he denied and for which he, indeed, has not initiated any efforts. Politically and legally, such a project would face massive hurdles, to say the least, and seems simply infeasible given the current makeup of the Congresso Nacional do Brasil. It therefore seems at least improbable that fears around the energy sector’s ownership model would significantly impact valuations.
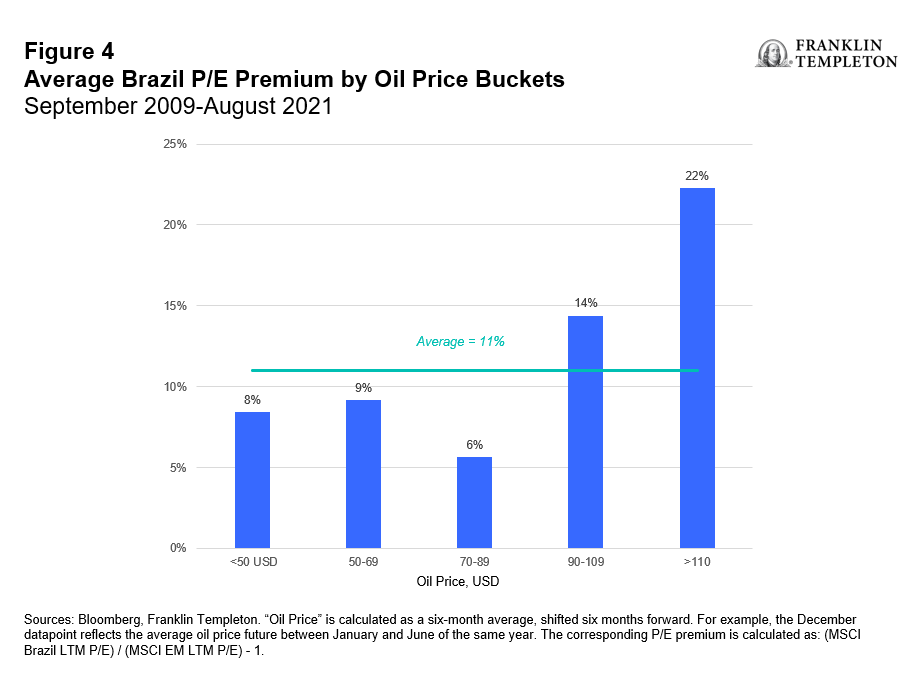
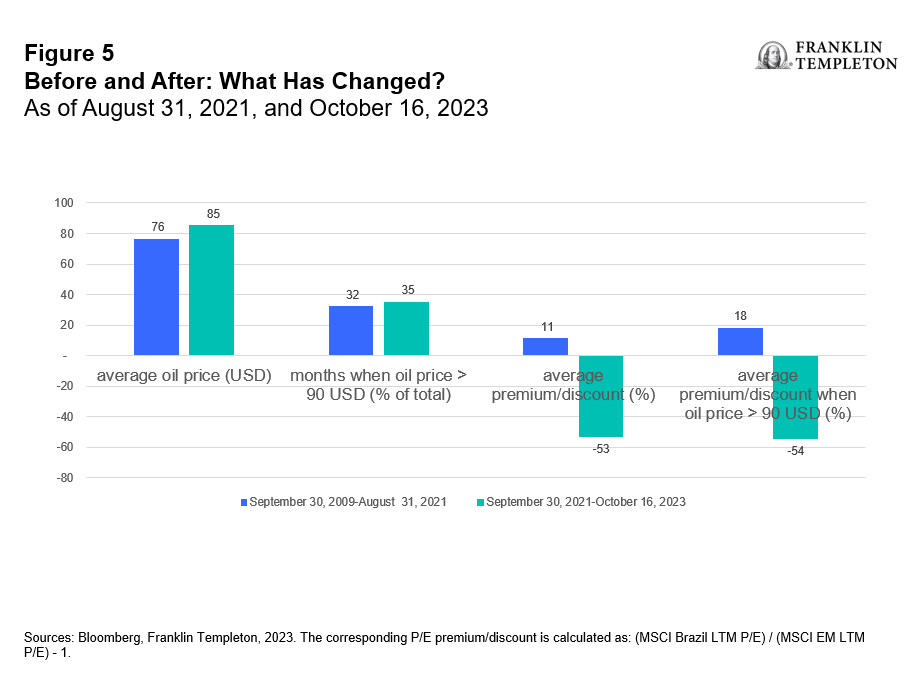
From September 2009 until August of 2021,12 Brazilian equities traded at an average premium versus broad emerging markets of 11% (Figure 4). When oil prices were below US$90, the premium was slightly lower, between 6% to 9% and with no observable correlation. Above US$90, however, the P/E premium grew higher as oil rose: for prices between US$90.00 and US$109.99, it averaged 14%, and for prices above US$110, it eclipsed 20%.13
In the sample period we analyzed, oil averaged US$76 pre-COVID, corresponding with the said 11% Brazil premium (Figure 5). Post-COVID, oil has been averaging US$85, but rather than rising in tandem, Brazilian equities are some 53% cheaper on average than their emerging market peers.14
In a theoretical all-else-equal world, this infers a massive repricing opportunity. Of course, all else is never equal. That is especially true in the aftermath of COVID, the ongoing war in Ukraine, US-China tensions and the recent outbreak of war in the Middle East, which has triggered fears of a regional or global escalation.
However, with a strong labor market, robust consumer confidence, and the prospect of further rate cuts on the back of falling inflation, we view Brazil as a bright spot in the global equity markets. Investors who share our analysis regarding the long-term prospects of Latin America’s largest economy may now find an attractive entry point—perhaps with the added potential to witness a repricing of valuations to pre-COVID levels relative to the price of oil.
ETFs trade like stocks, fluctuate in market value and may trade at prices above or below their net asset value. Brokerage commissions and ETF expenses will reduce returns. ETF shares may be bought or sold throughout the day at their market price (MP), not their Net Asset Value (NAV), on the exchange on which they are listed. Shares of ETFs are tradable on secondary markets and may trade either at a premium or a discount to their NAV on the secondary market.
Before investing, carefully consider a fund’s investment objectives, risks, charges and expenses. You can find this and other information in each prospectus, or summary prospectus, if available, at www.franklintempleton.com. Please read it carefully.
WHAT ARE THE RISKS?
All investments involve risks, including possible loss of principal. Equity securities are subject to price fluctuation and possible loss of principal.
International investments are subject to special risks, including currency fluctuations and social, economic and political uncertainties, which could increase volatility. These risks are magnified in emerging markets. Investments in companies in a specific country or region may experience greater volatility than those that are more broadly diversified geographically.
Commodity-related investments are subject to additional risks such as commodity index volatility, investor speculation, interest rates, weather, tax and regulatory developments.
IMPORTANT LEGAL INFORMATION
This material is intended to be of general interest only and should not be construed as individual investment advice or a recommendation or solicitation to buy, sell or hold any security or to adopt any investment strategy. It does not constitute legal or tax advice. This material may not be reproduced, distributed or published without prior written permission from Franklin Templeton.
The views expressed are those of the investment manager and the comments, opinions and analyses are rendered as at publication date and may change without notice. The underlying assumptions and these views are subject to change based on market and other conditions and may differ from other portfolio managers or of the firm as a whole. The information provided in this material is not intended as a complete analysis of every material fact regarding any country, region or market. There is no assurance that any prediction, projection or forecast on the economy, stock market, bond market or the economic trends of the markets will be realized. The value of investments and the income from them can go down as well as up and you may not get back the full amount that you invested. Past performance is not necessarily indicative nor a guarantee of future performance. All investments involve risks, including possible loss of principal.
Any research and analysis contained in this material has been procured by Franklin Templeton for its own purposes and may be acted upon in that connection and, as such, is provided to you incidentally. Data from third party sources may have been used in the preparation of this material and Franklin Templeton (“FT”) has not independently verified, validated or audited such data. Although information has been obtained from sources that Franklin Templeton believes to be reliable, no guarantee can be given as to its accuracy and such information may be incomplete or condensed and may be subject to change at any time without notice. The mention of any individual securities should neither constitute nor be construed as a recommendation to purchase, hold or sell any securities, and the information provided regarding such individual securities (if any) is not a sufficient basis upon which to make an investment decision. FT accepts no liability whatsoever for any loss arising from use of this information and reliance upon the comments, opinions and analyses in the material is at the sole discretion of the user.
Products, services and information may not be available in all jurisdictions and are offered outside the U.S. by other FT affiliates and/or their distributors as local laws and regulation permits. Please consult your own financial professional or Franklin Templeton institutional contact for further information on availability of products and services in your jurisdiction.
Issued in the U.S. by Franklin Distributors, LLC, One Franklin Parkway, San Mateo, California 94403-1906, (800) DIAL BEN/342-5236, franklintempleton.com – Franklin Distributors, LLC, member FINRA/SIPC, is the principal distributor of Franklin Templeton U.S. registered products, which are not FDIC insured; may lose value; and are not bank guaranteed and are available only in jurisdictions where an offer or solicitation of such products is permitted under applicable laws and regulation.
CFA® and Chartered Financial Analyst® are trademarks owned by CFA Institute.
__________
1. Sources: Bloomberg, FTSE. October 23, 2023. Past performance does not predict future returns. Indexes are unmanaged and one cannot invest directly in an index. Important data provider notices and terms available at www.franklintempletondatasources.com. The FTSE Brazil 30/18 Capped Index represents the performance of Brazilian large- and mid-capitalization stocks. The FTSE Brazil Index is a free float, market capitalization-weighted index designed to measure the equity market performance of Brazil. The FTSE Emerging index is an international equity index, which tracks stocks from emerging markets worldwide.
2. Source: Banco Central do Brasil.
3. Source: Bloomberg. 2023.
4. Ibid.
5. Sources: FactSet, Oxford Economics. 2023.
6. Sources: FactSet, IBGE. 2023.
7. Sources: FactSet, FGV, Franklin Templeton. 2023.
8. Sources: MSCI, Bloomberg, Franklin Templeton. 2023.
9. Source: US International Trade Administration. 2023.
10. Source: FTSE. 2023
11. Source: CEIC Data. 2023.
12. This is when most COVID-19 restrictions were lifted across Brazil’s major economic centers. We use this timeframe to define the pre- and post-COVID period.
13. Sources: Bloomberg, Franklin Templeton. 2023.
14. Ibid.