
 English
 Français
 Español
This post is also available in: French, Spanish
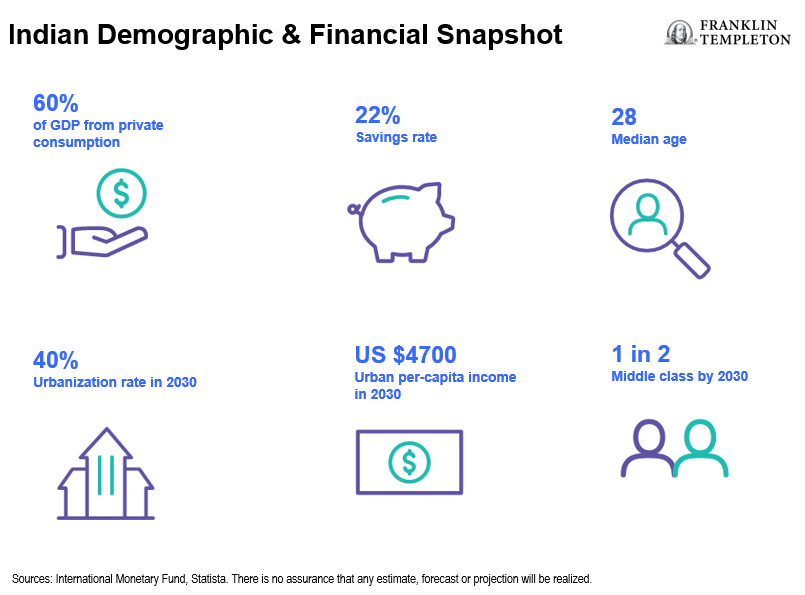
India is a dynamic urbanizing economy with a rapidly expanding middle class. The convergence of these megatrends is driving three themes that our investment team is focused on in our search for companies offering sustainable earnings growth with clear competitive advantage trading at a discount to their intrinsic value.
- Rising incomes. Urban per-capita annual income will grow to US$4,700 by 2030.1 This will boost spending power and accelerate the switch from informal to formal retail spending.
- Local consumption. Our team has identified three business models featuring the local Indian consumption theme: the sharing economy, service aggregation and subscription services.
- Global supply chain diversification. This theme is expected to benefit the technology and renewable energy industries.
Rising incomes
India is undergoing the same urbanization and middle-income growth trend that China experienced in the 2000s. The International Monetary Fund (IMF) estimates that India’s urban per-capita income will increase to US$4,700 by 2030, from US$2,200 currently.2 Historically, once an increasing number of consumers surpass US$3,000 in annual income, rapid growth in consumption, especially discretionary and durable goods, tends to follow.
Indian household characteristics
By 2030, 40% of the Indian population is forecast to be urban residents, up from 34% in 2018.3 Urban residents have higher income; a 2015 survey highlighted only 25% of households in rural areas had income over INR10,000 per month, whereas in urban areas this rose to 55%.4 Urbanization boosts female participation in the labor force from the current national average of 30% via greater access to education, transportation and sanitation. It is estimated that closing the gender gap would add two percentage points to gross domestic product (GDP) per year.5 Indian middle-income consumers are benefiting from the leapfrog effect via mobile first (defined as exclusively accessing the Internet via smartphones as opposed to personal computers). For many in this cohort moving to urban areas, their first interaction with a bank for financial products, shopping in the formal economy and consumption of digital content are all taking place via mobile as digitalization unleashes a wave of innovation. They are also driving the growth in digital payments: middle-income consumers are almost 50% more likely to use digital payments compared to lower income groups (48% cf.28%).6
Local consumption
Consumption patterns will be shaped by Indian-specific characteristics, including a preference for Indian food and beverage options, personal care and a shift toward private labels driven by the price consciousness of the Indian consumer. These patterns are driving innovations by local and international firms. These firms are adapting their menus to uniquely local Indian flavors as well as consumption preferences, including increased vegetarian offerings compared to other markets.
E-commerce distribution is also adapting to challenges, including urban sprawl and the absence of a national address database. As Indian consumers transition from unorganized to organized retail, their price consciousness implies they will move first to private-label brands. Bain, the consultancy, estimates that private-label apparel and grocery share of sales will rise to 50% of organized retail sales by 2030, up from 5%-10% share today.7
Similar to counterparts in other emerging markets (EMs), Indian consumers have found ways to access digital content for free. Currently, Indians spend the least on entertainment globally: 2%-3% of spending versus 11% in China and 16% in the United States.8 The takeaways from other markets—both EMs and developed markets—is that as incomes rise, consumers switch to paid entertainment content. Today, less than 10% of Indian viewers pay for video content. However, subscription to paid services is rising rapidly, led by affordable content streaming at US$15 per annum. Rising incomes could unlock a US$200 billion segment in India by 2030.9
Three business models featuring local consumption
- The sharing economy. India was the original ride-sharing market, with co-workers sharing rickshaws to work. Price-conscious Indian consumers are also more comfortable with secondhand white goods and motorbikes, compared with East Asian peers.
- Service aggregation. The rise in urbanization is giving rise to the aggregation of hitherto unorganized services, including cleaning, repair and beauty services. Many of these are available on digital platforms that drive adoption via peer reviews.
- Subscription models. Indian consumers are increasingly prepared to pay US$15 per annum for local content, compared to the same price per month in developed markets. The ability to try new brands and product categories at a small recurring fee is as important in India as it is in developed markets. The Indian-specific digital content business models service price-conscious, experience-seeking consumers utilizing an ample back catalog of Indian sports and Bollywood movies to drive subscriptions.
Global supply chain diversification
The post COVID-19 shift in global supply chain dynamics is benefiting India as global manufacturers adopt a China+1 strategy, defined as having an overseas production base in China plus one other country. This trend is driving large South Korean and Taiwanese manufacturers to invest in India to offset potential future regulatory and supply chain disruptions in China as well as providing access to the domestic Indian market.
India’s large pool of educated and skilled workers, in combination with greater tax certainty and improved infrastructure, is a key attraction. India’s working age population is rising by 10 million people per year with a median age of 28, rising to 31 by 2030.10 This compares with a dependency ratio, defined as the number of retirees and students relative to the number of working age people in the economy, forecast at 0.47 by 2030, compared with 0.52 in China and 0.61 in the United States.11
The millennial generation has significantly higher education attainment compared to Gen X, and the challenge for policymakers is creating an environment that is conducive to job creation, both for these savvy urban residents as well as rural peers. Awareness of this challenge is what contributed to the launch of a slew of schemes over the past decade to increase financial inclusion, reduce corruption and create a more predictable tax system.
Schemes and reforms include:
- Jandhan, the financial inclusion scheme giving bank account access to all citizens.
- Aadhar, the world’s largest biometrics-based identification system giving residents a permanent financial address.
- Value-added tax (VAT) reform, creating a national system.
The cumulative positive effects of these schemes are reflected in the World Bank’s Doing Business Index. India’s ranking improved from 142 in 2014 to 63 in 2021.12 While the pandemic impacted foreign direct investment (FDI) trends, global FDI dropped by 35% to US$1trillion in 2020, FDI in India rose by 27% to US$64 billion.13 The technology, industrials and health care sectors are attracting the highest share of inward FDI in India.
Production-linked incentives
The Production Linked Incentive (PLI) scheme and semiconductor investment proposal will distribute grants valued at US$40 billion over five years. The schemes are designed to capture the supply chain diversification opportunity, boost capital expenditure and raise domestic production. Of the 14 industries targeted with PLI grants, electronics (including semiconductors) and renewables account for almost half of the transfers. The technology and renewables sector stand out as beneficiaries of the PLI scheme. Tariffs are also playing a role in promoting import substitution as India takes a leaf out of China’s playbook when it was at a similar stage of development.
Sector beneficiaries: technology
The Indian technology sector grew revenue by 16% to US$22 billion in financial year 2022 with cloud, cybersecurity, data and artificial intelligence posting the fastest growth rates. Over the next four years, revenue is estimated to grow by 12.5% annually, rising to US$36 billion.14 The India technology and outsourcing business was valued at US$154 billion in 2019,15 boosted by labor costs that are less than a tenth of those in the United States and Europe for software developers. India’s business process outsourcing model leads the world and retains its competitive edge over peers in the Philippines, Poland and China as it climbs the value-added ladder.
The PLI scheme targets new growth areas in technology manufacturing via import substitution. We note that semiconductors and telecommunications network equipment face stiff competition globally for foreign direct investment, as almost every large economy seeks to build up domestic capacity, particularly in semiconductors. With its cost advantages, large domestic market and the use of tariffs to protect new manufacturers in their early stage of development, we believe that India can compete with East Asian peers.
Renewables
India has set a renewable energy target of 450 Gigawatts (GW) by 2030, with solar accounting for 62% of this new capacity. Current renewable energy production in India is equal to 39% of total power production. Assuming fossil fuel production continues to grow at 5% annually, renewables would account for 56% of total production by 2030. This implies 9% annual growth in total power production, which is consistent with the power needs of the economy over the remainder of the decade.16
Indian megatrends and investment implications
India is benefiting from the convergence of two megatrends: urbanization and an expanding middle class. These in turn are driving three themes our investment team is focused on: rising incomes, local consumption and global supply chain diversification. Over the 2022-25 period, India is forecast to witness the fastest economic growth in the emerging world.17 In combination with reforms to taxation, the banking sector and rising middle class incomes, this creates an attractive environment for the corporate sector to leverage the opportunities this growth will create.
What Are the Risks?
All investments involve risks, including the possible loss of principal. The value of investments can go down as well as up, and investors may not get back the full amount invested. Stock prices fluctuate, sometimes rapidly and dramatically, due to factors affecting individual companies, particular industries or sectors, or general market conditions. Investments in foreign securities involve special risks including currency fluctuations, economic instability and political developments. Investments in emerging markets, of which frontier markets are a subset, involve heightened risks related to the same factors, in addition to those associated with these markets’ smaller size, lesser liquidity and lack of established legal, political, business and social frameworks to support securities markets. Because these frameworks are typically even less developed in frontier markets, as well as various factors including the increased potential for extreme price volatility, illiquidity, trade barriers and exchange controls, the risks associated with emerging markets are magnified in frontier markets. To the extent a strategy focuses on particular countries, regions, industries, sectors or types of investment from time to time, it may be subject to greater risks of adverse developments in such areas of focus than a strategy that invests in a wider variety of countries, regions, industries, sectors or investments.
Any companies and/or case studies referenced herein are used solely for illustrative purposes; any investment may or may not be currently held by any portfolio advised by Franklin Templeton. The information provided is not a recommendation or individual investment advice for any particular security, strategy, or investment product and is not an indication of the trading intent of any Franklin Templeton managed portfolio.
Important Legal Information
This material is intended to be of general interest only and should not be construed as individual investment advice or a recommendation or solicitation to buy, sell or hold any security or to adopt any investment strategy. It does not constitute legal or tax advice. This material may not be reproduced, distributed or published without prior written permission from Franklin Templeton.
The views expressed are those of the investment manager and the comments, opinions and analyses are rendered as at publication date and may change without notice. The underlying assumptions and these views are subject to change based on market and other conditions and may differ from other portfolio managers or of the firm as a whole. The information provided in this material is not intended as a complete analysis of every material fact regarding any country, region or market. There is no assurance that any prediction, projection or forecast on the economy, stock market, bond market or the economic trends of the markets will be realised. The value of investments and the income from them can go down as well as up and you may not get back the full amount that you invested. Past performance is not necessarily indicative nor a guarantee of future performance. All investments involve risks, including possible loss of principal.
Any research and analysis contained in this material has been procured by Franklin Templeton for its own purposes and may be acted upon in that connection and, as such, is provided to you incidentally. Data from third party sources may have been used in the preparation of this material and Franklin Templeton (“FT”) has not independently verified, validated or audited such data. Although information has been obtained from sources that Franklin Templeton believes to be reliable, no guarantee can be given as to its accuracy and such information may be incomplete or condensed and may be subject to change at any time without notice. The mention of any individual securities should neither constitute nor be construed as a recommendation to purchase, hold or sell any securities, and the information provided regarding such individual securities (if any) is not a sufficient basis upon which to make an investment decision. FT accepts no liability whatsoever for any loss arising from use of this information and reliance upon the comments, opinions and analyses in the material is at the sole discretion of the user.
Products, services and information may not be available in all jurisdictions and are offered outside the U.S. by other FT affiliates and/or their distributors as local laws and regulation permits. Please consult your own financial professional or Franklin Templeton institutional contact for further information on availability of products and services in your jurisdiction.
Issued in the U.S. by Franklin Distributors, LLC, One Franklin Parkway, San Mateo, California 94403-1906, (800) DIAL BEN/342-5236, franklintempleton.com – Franklin Distributors, LLC, member FINRA/SIPC, is the principal distributor of Franklin Templeton U.S. registered products, which are not FDIC insured; may lose value; and are not bank guaranteed and are available only in jurisdictions where an offer or solicitation of such products is permitted under applicable laws and regulation.
__________________
1. Source: International Monetary Fund, World Economic Outlook, April 2022. There is no assurance that any estimate, forecast or projection will be realized.
2. Source: Ibid.
3. Source: World Economic Forum, Bain: “Future of Consumption in Fast-Growth Consumer Markets: INDIA,” 2019. There is no assurance that any estimate, forecast or projection will be realized.
4. Source: Statista, 2015.
5. Source: Aguirre, D. et al. .“Empowering the Third Billion: Women and the World of Work.” Booz & Co.2010.
6. Source: National Payments Corporation of India.
7. Source: World Economic Forum, Bain: “Future of Consumption in Fast-Growth Consumer Markets: INDIA,” 2018.
8. Ibid.
9. Ibid.
10. Ibid.
11. Ibid.
12. Source: World Bank.
13. Source: UN Conference on Trade and Development (UNCTAD).
14. Source: National Association of Software and Services Companies (NASSCOM). There is no assurance that any estimate, forecast or projection will be realized.
15. Ibid.
16. Source: Ministry of Power.
17. Source: IMF World Economic Outlook, April 2022.